- 您现在的位置:买卖IC网 > Sheet目录326 > FSICEBASE (Freescale Semiconductor)BASE STATION FSICE FOR MCU MOD
Using the Debugger
Viewing Memory
c. Click OK — the debugger opens a new Memory window.
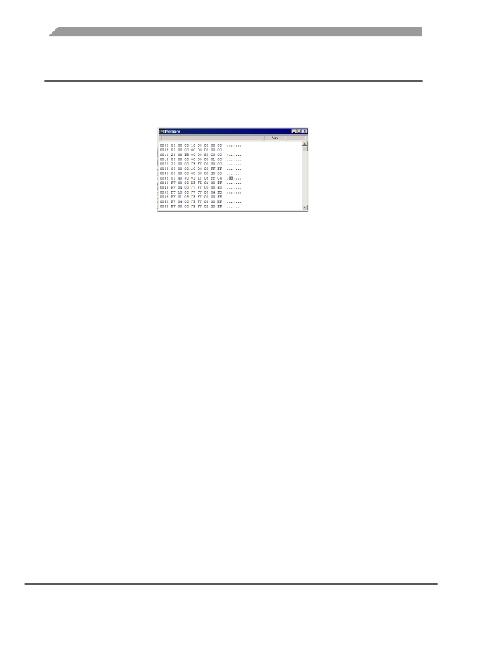
Figure 5.4 Memory Window
The Memory window shows memory addresses in the far left column. The second
column shows the value contained in that address. The next column shows the value
contained in the next higher address, and so on. Each row shows the values of sixteen
addresses. The layout changes if you instruct the Memory window to display a
different numeric format.
The far right area of the window shows the corresponding ASCII representation of the
values. Control and other non-printing characters appear as periods.
2. To view values in a different numeric format:
a. Right click mouse in Memory window — drop-down menu appears
b. Select Format — drop-down menu appears
c. Select a format such as Hex, Dec, or Bin
Memory window displays values in format that you selected.
3. To change the display update mode
a. Right click mouse in Memory window — drop-down menu appears
b. Select Mode — drop-down menu appears
c. Select a mode: Automatic - updates when the debugger issues a command, such as
after stepping, Periodical - updates at the specified time interval, Frozen - never
updates
4. Use scroll bar of Memory window to navigate to desired memory addresses.
5. To display a specific address:
a. Right click mouse in Memory window — drop-down menu appears
b. Select Address — Display Address dialog box (Figure 5.5) appears
Freescale In-Circuit Emulator Base User Manual, Rev. 1.1
58
Freescale Semiconductor
发布紧急采购,3分钟左右您将得到回复。
相关PDF资料
FT24C02A-5LR-T
IC EEPROM 2KBIT 1MHZ SOT23-5
FT24C16A-UMR-B
IC EEPROM 16KBIT 1MHZ 8MSOP
FT24C256A-UMR-B
IC EEPROM 256KBIT 1MHZ 8MSOP
FT24C512A-UDR-B
IC EEPROM 512KBIT 1MHZ 8DIP
FT24C64A-UMR-B
IC EEPROM 64KBIT 1MHZ 8MSOP
FT822AA
IC LED DRVR PFC LOW TDH 8SOP
FT881A
IC LED DRVR 30W 8SOP
FT93C46A-ITR-B
IC EEPROM 1KBIT 2MHZ 8TSSOP
相关代理商/技术参数
FSICECBLBSA
功能描述:仿真器/模拟器 BUS ANALYZER CABLE RoHS:否 制造商:Blackhawk 产品:System Trace Emulators 工具用于评估:C6000, C5000, C2000, OMAP, DAVINCI, SITARA, TMS470, TMS570, ARM 7/9, ARM Cortex A8/R4/M3 用于:XDS560v2
FSICECBLBSAE
功能描述:仿真器/模拟器 BUS ANALYZER CABLE RoHS:否 制造商:Blackhawk 产品:System Trace Emulators 工具用于评估:C6000, C5000, C2000, OMAP, DAVINCI, SITARA, TMS470, TMS570, ARM 7/9, ARM Cortex A8/R4/M3 用于:XDS560v2
FSICEKITAP64
功能描述:仿真器/模拟器 FSICE EMULATOR KIT FOR 9
RoHS:否 制造商:Blackhawk 产品:System Trace Emulators 工具用于评估:C6000, C5000, C2000, OMAP, DAVINCI, SITARA, TMS470, TMS570, ARM 7/9, ARM Cortex A8/R4/M3 用于:XDS560v2
FSICEKITASAZ
功能描述:仿真器/模拟器 FSICE EMUL FOR 908ASAZ
RoHS:否 制造商:Blackhawk 产品:System Trace Emulators 工具用于评估:C6000, C5000, C2000, OMAP, DAVINCI, SITARA, TMS470, TMS570, ARM 7/9, ARM Cortex A8/R4/M3 用于:XDS560v2
FSICEKITEY
功能描述:仿真器/模拟器 FSICE EMULATOR KIT FOR 9
RoHS:否 制造商:Blackhawk 产品:System Trace Emulators 工具用于评估:C6000, C5000, C2000, OMAP, DAVINCI, SITARA, TMS470, TMS570, ARM 7/9, ARM Cortex A8/R4/M3 用于:XDS560v2
FSICEKITGPGT
功能描述:仿真器/模拟器 FSICE EMULATOR KIT FOR 9
RoHS:否 制造商:Blackhawk 产品:System Trace Emulators 工具用于评估:C6000, C5000, C2000, OMAP, DAVINCI, SITARA, TMS470, TMS570, ARM 7/9, ARM Cortex A8/R4/M3 用于:XDS560v2
FSICEKITGRGZ
功能描述:仿真器/模拟器 FSICE EMULATOR KIT FOR 9
RoHS:否 制造商:Blackhawk 产品:System Trace Emulators 工具用于评估:C6000, C5000, C2000, OMAP, DAVINCI, SITARA, TMS470, TMS570, ARM 7/9, ARM Cortex A8/R4/M3 用于:XDS560v2
FSICEKITJB8
功能描述:仿真器/模拟器 FSICE EMUL FOR 908JB8
RoHS:否 制造商:Blackhawk 产品:System Trace Emulators 工具用于评估:C6000, C5000, C2000, OMAP, DAVINCI, SITARA, TMS470, TMS570, ARM 7/9, ARM Cortex A8/R4/M3 用于:XDS560v2
